Monitoring and scaling a production web app can be daunting. With so many components and metrics to track, where do you focus?
Request queue time stands out as the essential metric for server health and horizontal scaling, but it’s also one of the least understood. In this post, I’ll explain what request queue time is, how to measure it, and how to use those measurements to improve your app performance.
What is request queue time?
Request queue time is the time passed between a load balancer receiving a request and the application code processing the request. It’s how long a request has to “wait” before actual processing begins.
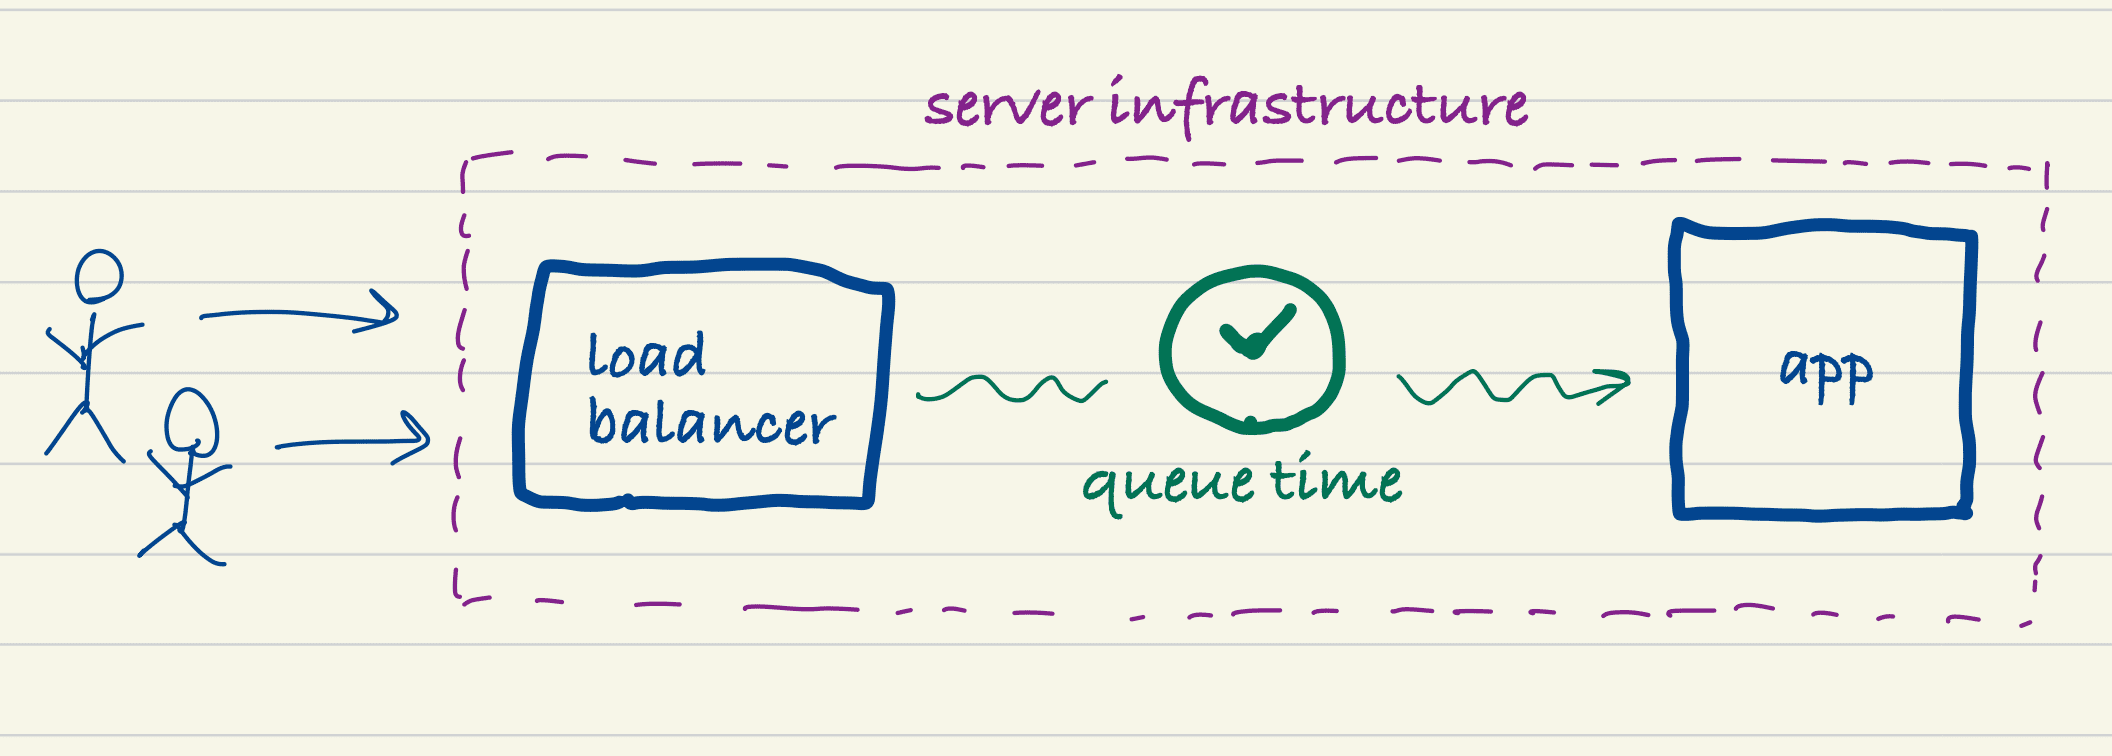
In an optimally configured and scaled infrastructure, 5-10ms queue time is typical. As we’ll see later, some queue time will always be present since it includes network time between infrastructure components.
To understand this better, let’s step back and look at the full web request lifecycle.
Web request lifecycle
We’re going to ignore things like browsers and DNS for this discussion and focus only on web requests from the perspective of your web server infrastructure.
The first component to receive a web request is your load balancer. If you’re running on AWS, this is probably an ELB (Elastic Load Balancer) instance. On your own infrastructure, you might be load-balancing with NGINX or HAProxy. On Heroku, a proprietary load balancer passes the request to a set of routers.
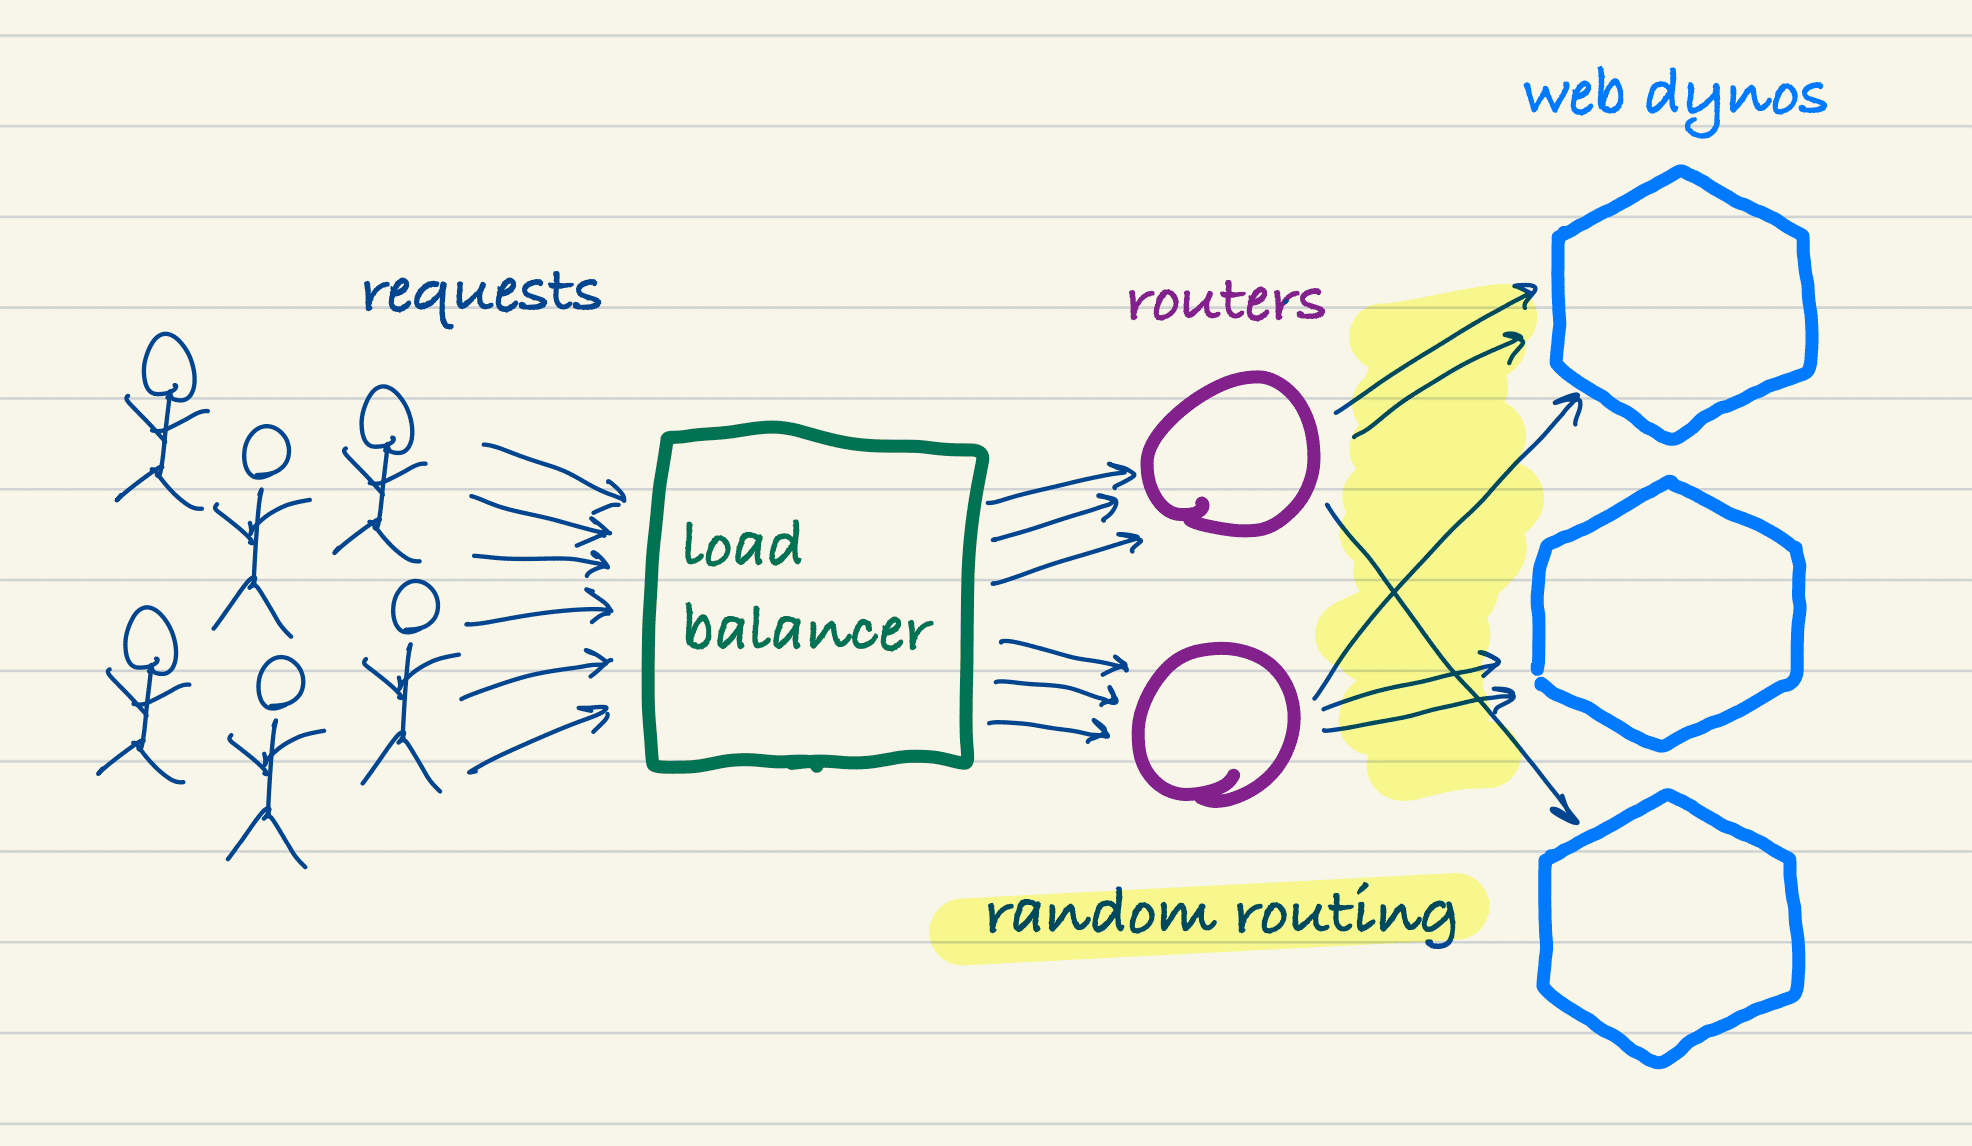
This post will primarily use Heroku terminology, but the concepts apply to any infrastructure.
The router is responsible for forwarding the request to one of your active web dynos (a “dyno” is a Heroku container). Heroku uses a random routing algorithm, so you cannot expect your least busy dyno to receive the request.
A web dyno receives the request via a web server such as Puma. The web server buffers the request and hands it to an available application process, where your app code finally begins processing the request.
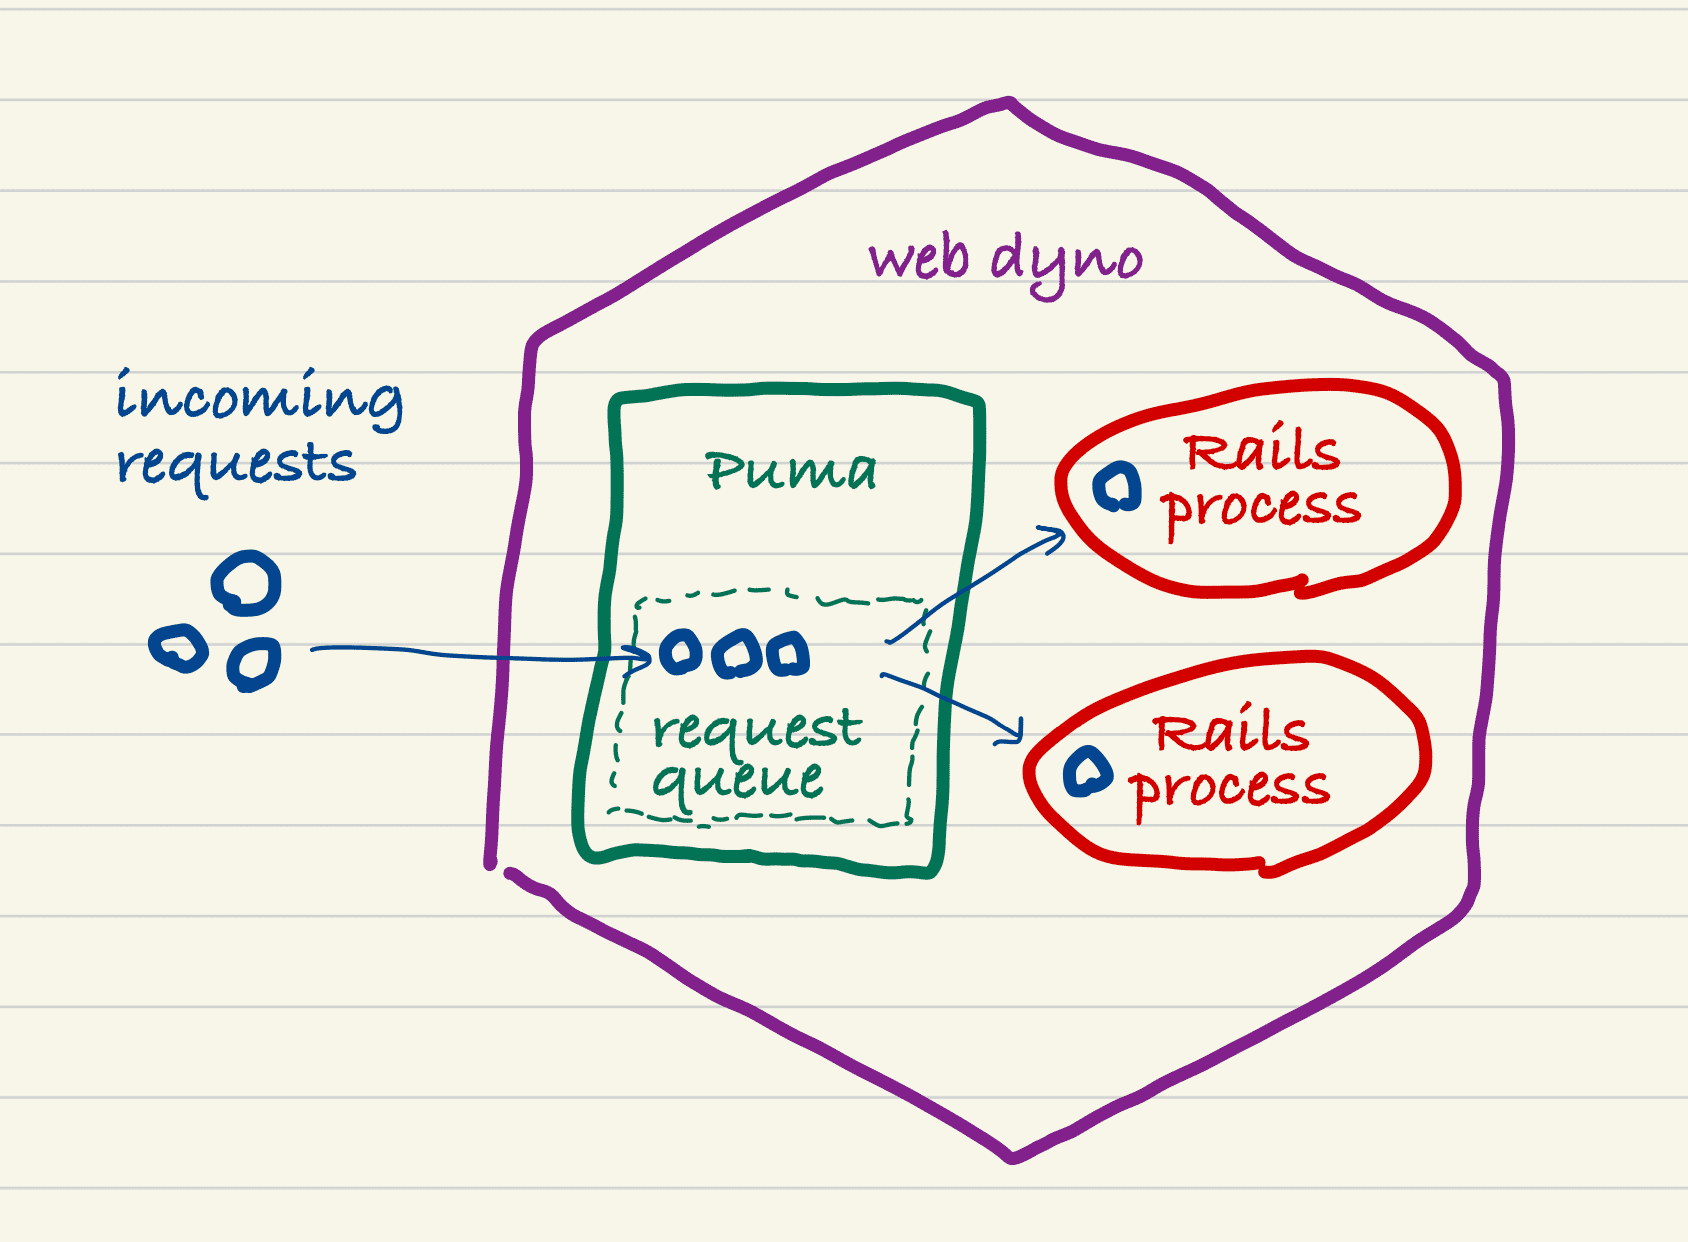
You can have many app processes running on a dyno or container, and it’s the web server’s job to queue the request if all of those app processes are busy. Waiting for an available app process is the heart of request queueing. It’s pure waste, and we’ll talk later about how to avoid it.
After your app code runs, the response is sent back through the same components until finally sent back to the client.
Web request metrics
You’ll typically encounter three important metrics on the server-side of a web request:
- Service time is the total time to service the request, from when the load balancer receives it until the response is sent back to the client. It’s typically too broad a metric to be actionable on its own.
- App time is the time spent in the application code and any upstream dependencies such as database queries. This is the metric you can impact directly with the code you write.
- Queue time is the time spent before getting picked up by the application code. It includes network time between the load balancer, router, and web dyno, and it includes time spent waiting for an available app process within a web dyno. This metric is a direct reflection of server capacity, rather than app performance.
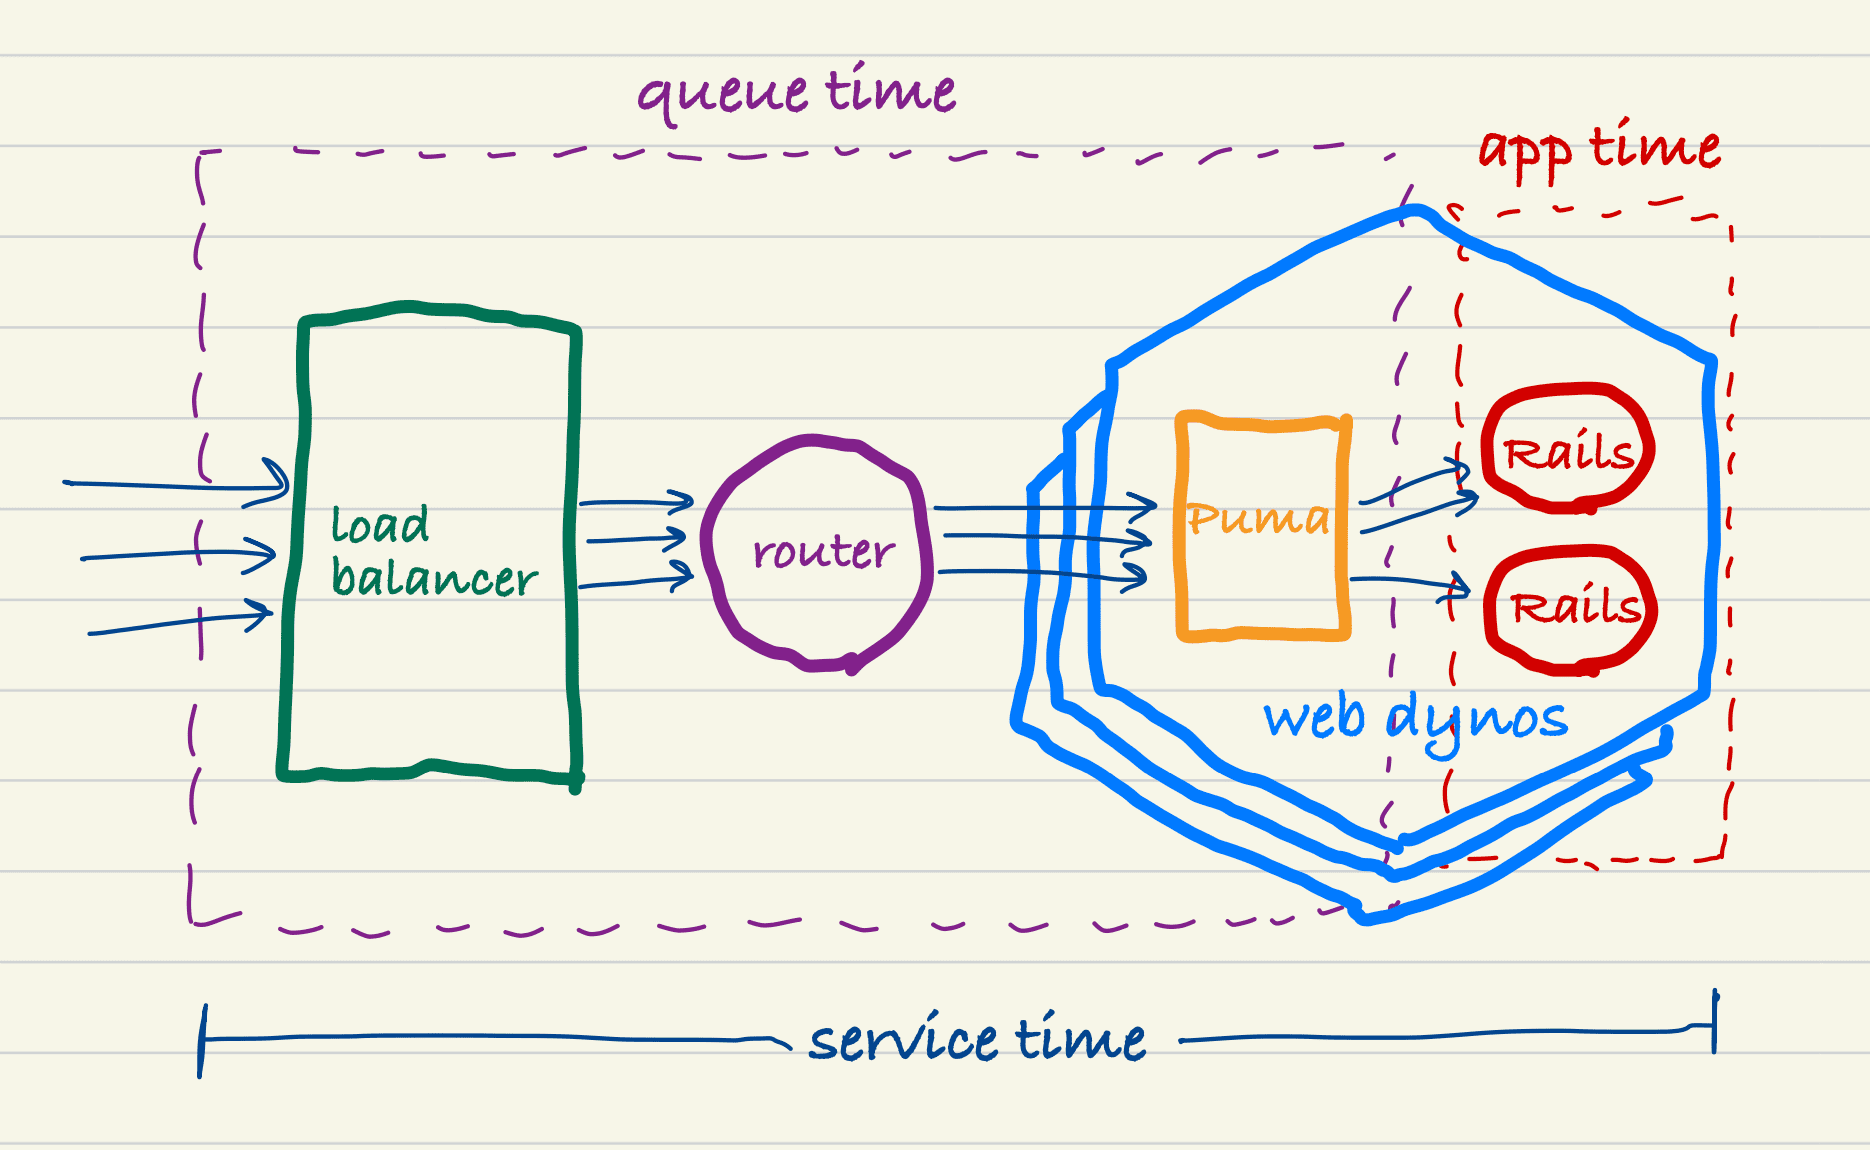
Notice that service time is the superset of queue time and app time.
App Time + Queue Time
Service time might also include the network time sending the response back to the client. This is usually negligible and safe to ignore.
Why is request queue time so important?
What do these metrics mean in terms of app performance and scaling? If you take away one thing, remember this:
App time is all about your code, and queue time is all about your servers.
Service time is generally not a helpful metric on its own. A slow, inefficient app can have short queue times, and a very efficient app can have long queue times. Service time would be the same in either case, but you would address the issue with very different approaches.
Queue time is the only measurement that tells you if your servers have capacity for more requests or if they’re already pushed beyond their limits. CPU and memory might give you some hints about this, but they don’t tell you the actual impact on your users.
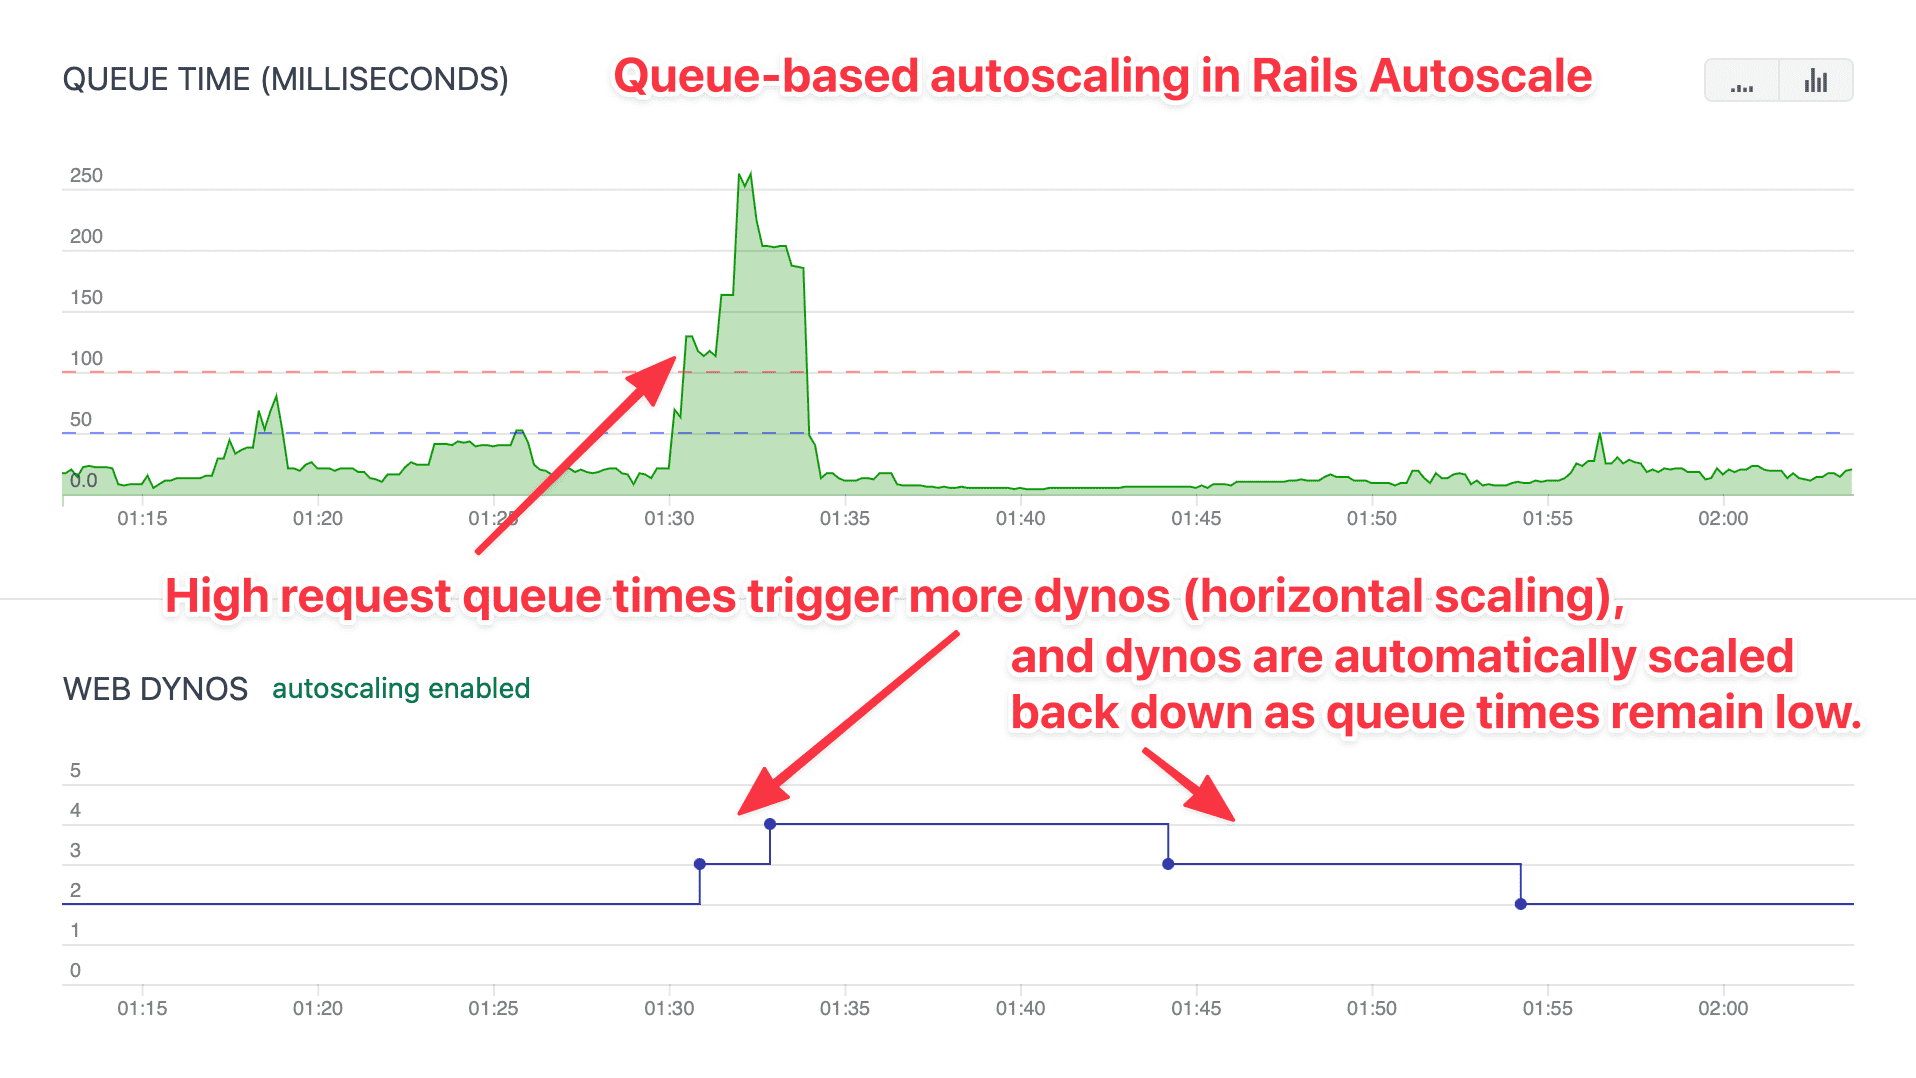
Queue time shows the user impact of your server capacity. If your request queue time is increasing, you very likely need more dynos. If your request queue time never increases, you might be over-provisioned and could reduce spending by decreasing dynos.
How is request queue time measured?
If you’re not already monitoring request queue time, it’s crucial to understand how to measure it. Most tools that measure request queue time use a request header added by the load balancer. This request header marks the time at which the request entered the load balancer.

Heroku adds this header automatically, and it’s configurable in NGINX and HAProxy. ELB does not provide a way to set this header, making queue time hard to measure on AWS.
Your application is aware of when it begins processing the request, so it can use this header to calculate the difference between the two timestamps. In Rails, you would typically do this calculation in a Rack middleware.
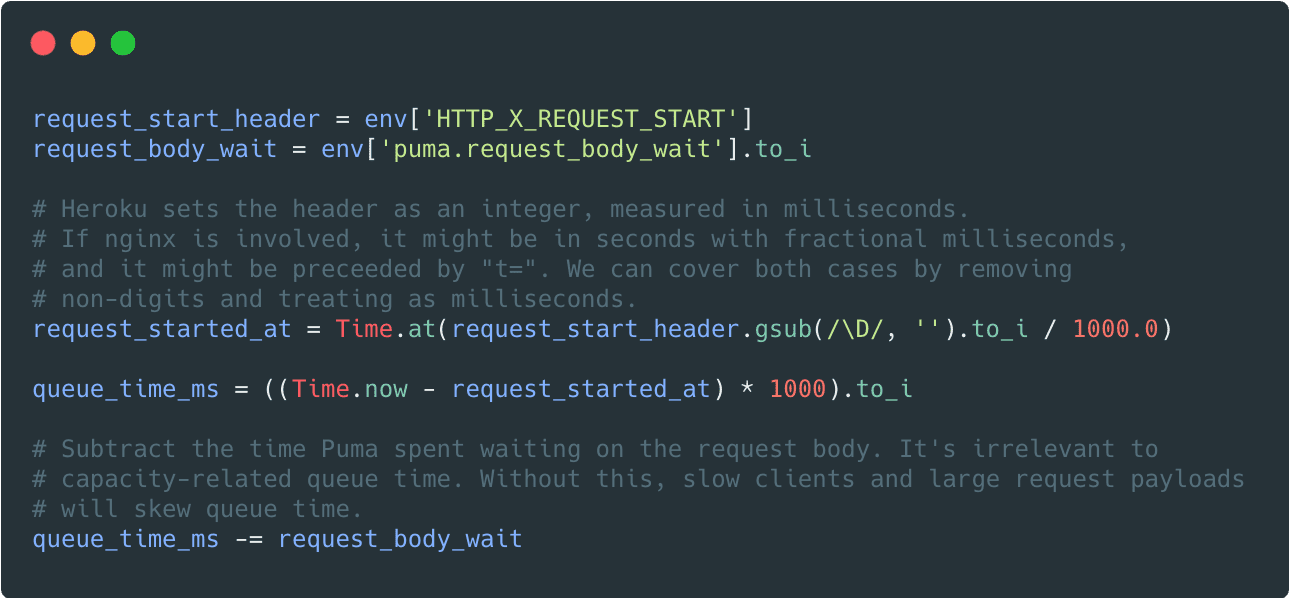
Several tools will handle this for you:
- New Relic — Suite of products for observing your entire infrastructure.
- Scout APM — Performance monitoring for several languages and frameworks.
- Rails Autoscale — Powerful autoscaling for Heroku.
For Rails apps, each of these tools provides a Ruby gem that adds middleware to your app. The middleware measures request queue time before any other app processing takes place.

Factors that impact request queue time
As you measure and monitor your request queue time, keep in mind the following factors that cause high queue times:
- Too few dynos or containers. The most common culprit of high queue times. If you don’t have enough web dynos to support your current traffic load, requests will inevitably queue as they wait for available app processes.
- Too few app processes per dyno. Since Heroku uses a random routing algorithm, requests are not distributed evenly across your web dynos. Even if you think you have sufficient web dynos for your current traffic, you also need some “in-dyno concurrency” to handle this unbalanced routing behavior. It’s ideal to have least three web processes running on each dyno.
- Large request payloads. Queue time includes network transport time as the request makes its way to a web dyno, and this network time will be higher for large request payloads.
- Slow clients. Just like large request payloads, slow clients (such as a phone on a poor cellular connection) will require more network time, thus higher queue time.
- NTP drift. Heroku uses the Network Time Protocol (NTP) to synchronize system time across its entire architecture, but clocks sometimes still drift out of sync. This drift can cause queue time anomalies because queue time is usually measured using timestamps from two independent machines.
- Slow app code. Wait! Didn’t I just say queue time is separate from app performance? Yes, but slow requests can create a bottleneck in your app servers, which causes other requests to queue. Let’s dive into this relationship…
How your code impacts request queue time
App time and queue time measure different things, but that doesn’t mean they exist independently of one another.
A few slow requests can cause many other requests to “stack up” behind them, sometimes even resulting in the dreaded H12 Request Timeout errors on Heroku.
Adding more dynos will not improve slow app endpoints, but it can help mitigate the cascading effects of subsequent request queueing. Horizontal scaling (adding dynos) is essentially a band-aid to stop the bleeding in this scenario, but it doesn’t fix the problem.
So if request queue time and app time are high, what do you do?
- First, add more dynos to reduce request queue time and “stop the bleeding”. This will not improve app times, but it will improve user experience and avoid H12 errors.
- If you’re not using an APM like Scout or New Relic, add one of these tools to identify which requests are slow and why they are slow.
- Often, improving app performance can be as simple as moving some synchronous processing into a background job, or adding pagination to a request that’s querying and rendering far more data than is necessary.
Using request queue time in practice
As we’ve seen request queue time is the key metric for understanding server capacity. Service time is too broad, and app time is unrelated to server capacity. It’s critical to monitor request queue time to know if you’ve over-provisioned or under-provisioned your web dynos.
Request queue time is also the perfect metric for autoscaling. Make sure you’re using an autoscaler like Rails Autoscale that leverages request queue time for autoscaling by default.
Next steps
If you’re not at least monitoring your request queue time, that’s a must. Use Scout or New Relic to monitor your queue time alongside other app performance metrics, but remember not to conflate the two. “App performance” metrics are driven by the code you write. Queue time is most influenced by your infrastructure setup.
Use these metrics to optimize your production environment. Run at least three app processes per dyno, and add or remove dynos based on your queue time. And if your traffic fluctuates at all, consider automating this process via autoscaling.
